Symplify Insights: see what’s working across every channel

Your CRM data already holds the answers. Insights is an add-on that brings them to the surface: clear dashboards built into Symplify that show where you’re winning, where you’re slipping, and what to do next.


Already a customer? Reach out to your Customer Success Manager.

No exports, no spreadsheets

How did this month compare with last? Are your automations earning their keep? Which journeys need attention? Answering questions like these tends to mean exporting the numbers and rebuilding them in a spreadsheet or BI tool.


With Insights, they’re answered inside Symplify, with nothing to set up and up to 12 months of history from the day it’s switched on.
Your one-page health check

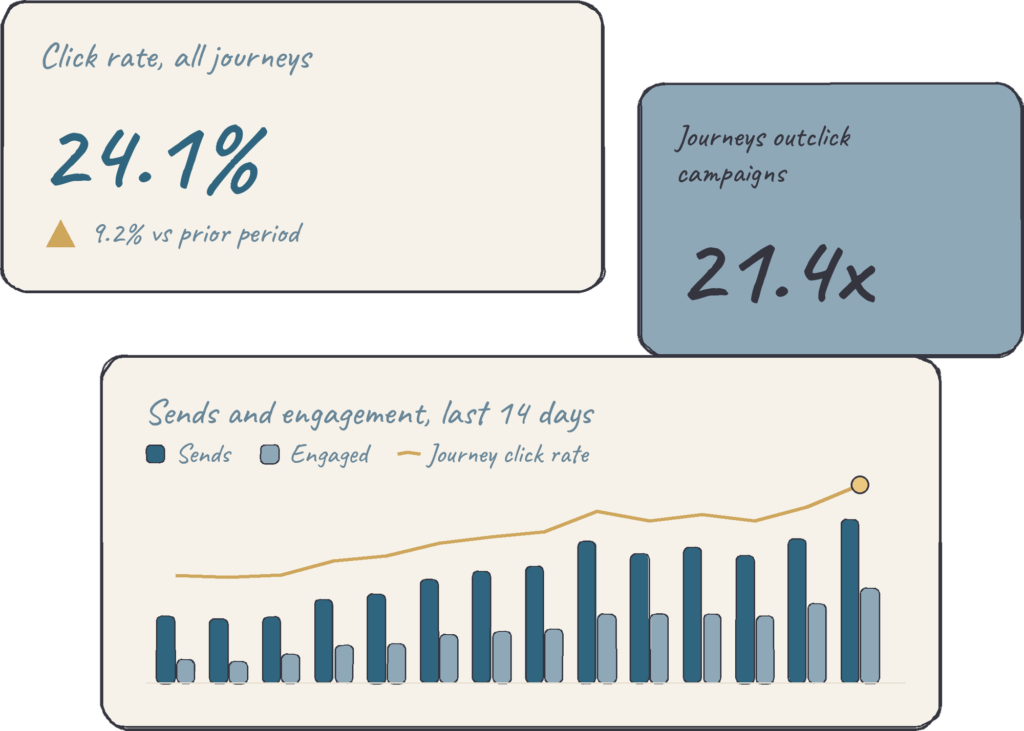
The Account Brief is your one-page health check for a regular review. It shows your volume, reach and engagement, how automations compare with campaigns, which journeys improved or dropped, and how your sending has trended over time.

Questions you can answer in one click

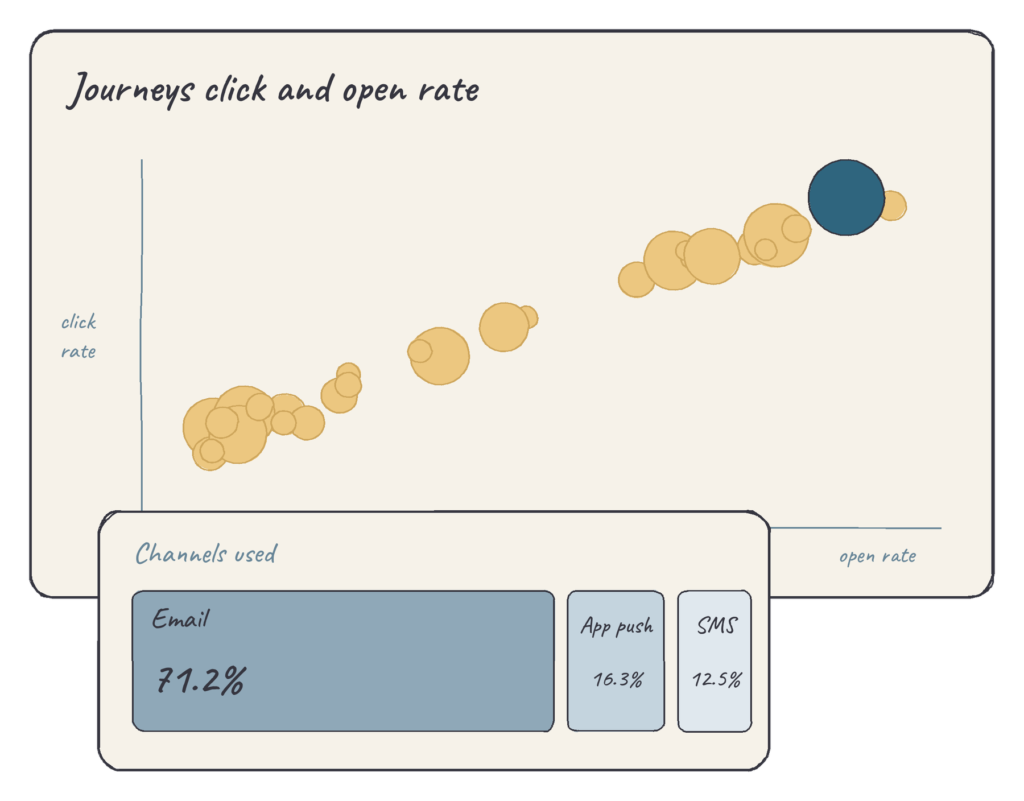
Four questions every CRM team asks, each answered on a single screen.

Drill down to the detail

Pick any period and the previous one is compared automatically. Filter every chart at once by project or by contact attributes like country and membership level, and combine two for a sharper view.


With DataDocs, you can also focus on contacts who hold a specific document, like a booking or an order.
Symplify Reports show the results.

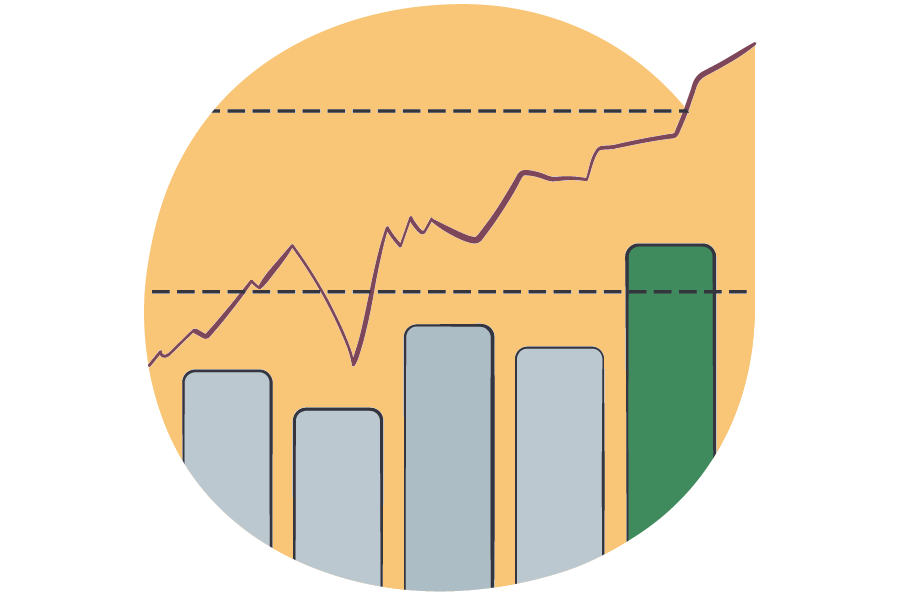
Insights shows what they mean over time.
In Symplify Reports
With Insights
Engagement
See opens and clicks for a sendout.
See how engagement develops across your communication.
Automations
See how an automated journey performs.
Compare the impact of automations versus campaigns.
Historical data
Review results from previous sendouts.
Discover trends across 12 months of communication.
Journey performance
Review statistics for a journey.
Identify which journeys improved or declined.
Audience analysis
View and segment your contacts.
See how different audiences engage with your messages.
Email performance
See opens and clicks for an email.
Discover how engagement varies by send hour and inbox provider.

Built to be trusted

We built Insights together with our customers, around the questions their CRM teams need answered.


It runs on a separate analytics warehouse, so it never slows down your sending. Every tile explains exactly what it shows, and personal details like email addresses and phone numbers are never available as filters.

FAQs

Symplify Insights is a set of analytics dashboards inside Symplify. It adds up everything you send across email, SMS and App Push over any period you choose, and compares it with the period before, with no exports or spreadsheets.

Reports show how one sendout performed. Insights shows how everything you send is performing, so you can spot trends and decide what to do next.

Insights is updated on an ongoing basis. Today’s figures are partial, so the latest day can still change.

Up to 13 months of message history is loaded when Insights is switched on, and it keeps growing from there.

Insights is an add-on. Contact your Customer Success Manager to activate it.

Once it’s activated, choose Insight in the app menu, next to Communication and Conversion. The Account Brief is the first dashboard you’ll see.

Ready to see the full picture?

Already a customer? Reach out to your Customer Success Manager.